¶ Understanding the ProfitTrailer indicators.
"Indicators are statistics used to measure current conditions as well as to forecast financial or economic trends". - Investopedia.com
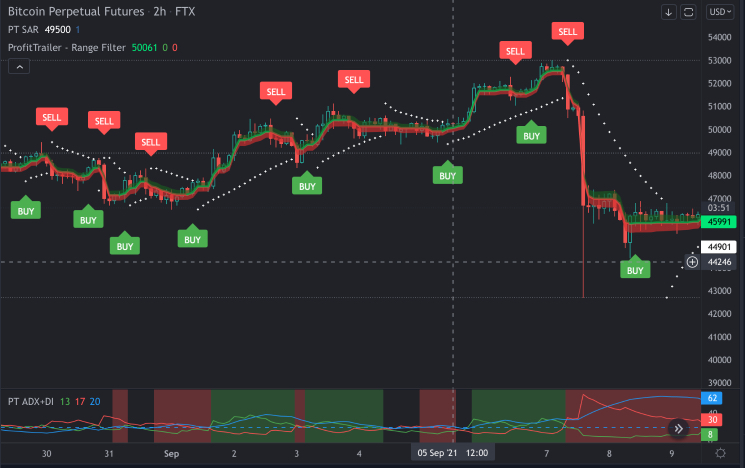
(BTC chart on the 2 hour candle period with PT SAR, RANGEFILTER and ADX+DI indicators)
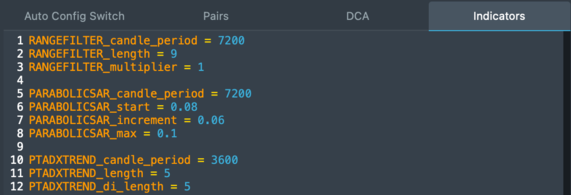
(Representation of these 3 indicators using ProfitTrailer)
¶ Introduction
The ProfitTrailer indicators are aligned with buy and sell strategies. Meaning you will always need an indicator to set up your intended strategy. These indicators also belong in a seperate tab (under Active Config),
whereas your values for buying belong in the Pairs tab (see the picture above). The indicators tab is a little bit like the motor behind ProfitTrailer, or.. whats going on "under the hood".
So what are Indicators in the world of ProfitTrailer? You could call them the roots of your strategies, as they serve as the building block to create and fine-tune your strategy.
It's the place where the settings go such as candle periods, lengths, offsets and more.
To summarize:
- In the Pairs tab we tell ProfitTrailer when to trigger a signal (e.g.
DEFAULT_A_buy_strategy = RSI,DEFAULT_A_buy_value = 20,DEFAULT_B_buy_value = 1,... etc). - In the Indicators tab we write the properties for those strategies that should trigger the signals (e.g.
RSI_candle_period = 7200,RSI_length = 14,... etc).
¶ What indicators can we use in ProfitTrailer?
- Here is a list of all the buy and sell strategies ProfitTrailer currently supports.
Each indicator comes with his own parameters which can be found here.
Confirm you are using the right code by double checking. The indicator will not work as intended if you do not provide all the given parameters for each strategy.
¶ How are indicators on Tradingview translated to ProfitTrailer?
Each indicator on Tradingview gives you access to change the settings.
In order to change those values click on the settings knob for your current indicator. As shown below:
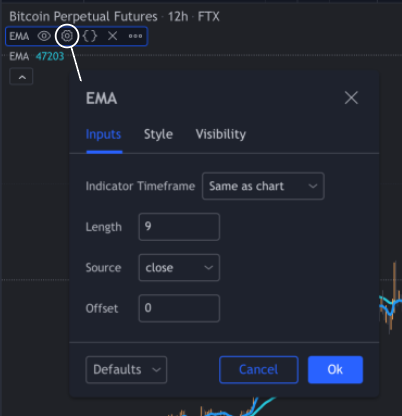
What we are looking at here are the settings of the EMA line on Tradingview. It shows:
- Indicator Timeframe = here you can select what timeframe (or candle period in ProfitTrailer terms) to look at.
In this example it's looking at the same timeframe as the chart, which is 12 hours and would equal to 43200 seconds for ProfitTrailer (thus: EMA_candle_period = 43200). - Length = here you can select the ema length. In ProfitTrailer this would be EMA_length = 9.
¶ Measurements
As you might have noticed most of the measurements are the same as the ones you see on TradingView. However there is an exception: candle period or timeframes.
- ProfitTrailer's candle periods are measured in seconds, unlike Tradingview which uses minutes, hours or days.
See the list below to save yourself some time and calculation:
1m = 60
5m = 300
15m = 900
30m = 1800
1h = 3600
2h = 7200
4h = 14400
8h = 28800
12h = 43200
1d = 86400
For example, you could use the following lines in the Indicators tab:
RSI_candle_period = 7200
BB_candle_period = 1800
etc.
Important: Make sure your exchange supports the given candle period!
¶ Setting up the right indicator settings for our buy strategy.
So now that we learned on how to analyse and read indicators in Tradingview, we can set them up in ProfitTrailer.
In order to do that, go to the Indicators tab located in Active Config and set the right values for the corresponding buy strategy. More info about the Indicators here.
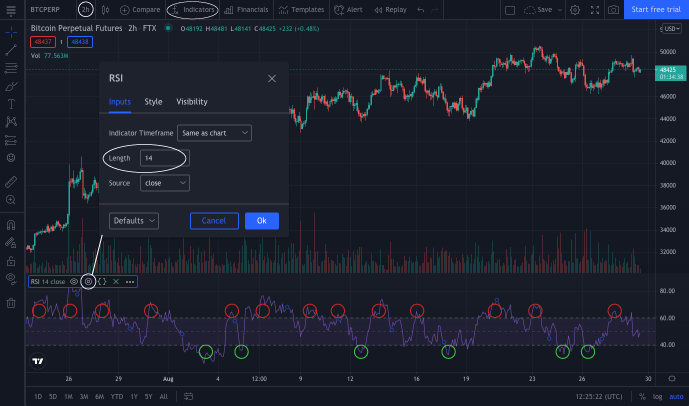
- Using our example above, we would need the following lines in our Indicators tab:
RSI_candle_period = 7200(because 7200 seconds = 2 hours and that's what we were looking at in the chart above).
RSI_length = 14(because that's the length we used in the example above).
Click the Save icon at the top of your config and you're all set!
Now that all of that is done, our indicator should work identically to what we've visualized in our example.
Attention: We always suggest to run your bot in Test Mode for a few weeks before really taking off. Just to make sure there are no mistakes left in your code and to avoid unnecessary losses or wrong entries and/or exits.